The Election Assistance Commission (EAC) administers the biennial Election Administration and Voting Survey (EAVS) to collect state-by-state data on the administration of federal elections. In June of 2017, the EAC released the most recent survey with data from the 2016 election.
This survey contains the most comprehensive data about trends in election administration in the United States and provides these numbers at the national, state and local level. This brief is part of a series of “deep dives” into the EAVS data that will provide an in-depth look at a variety of issues related to administering elections and use data to help better understand these issues.
Overview
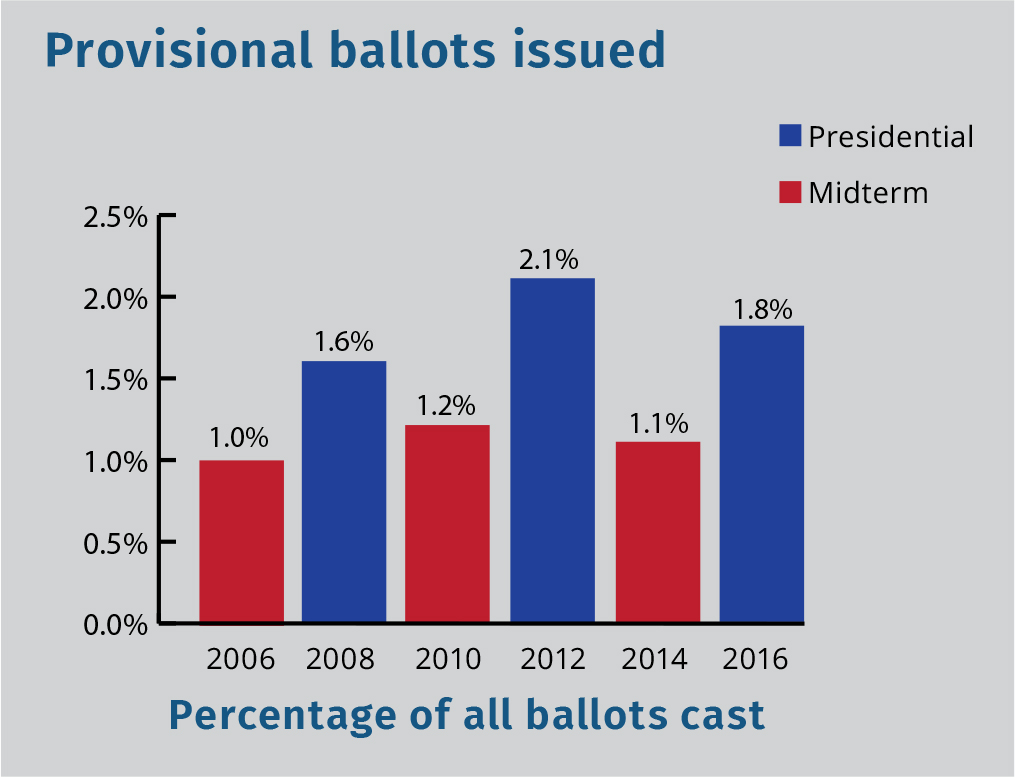
- Rates of provisional ballot use have remained steady since 2006. However, there are differences between presidential elections and midterm elections. In presidential cycles provisional ballots account for approximately 1.8 percent of all ballots cast, compared with about 1.1 percent of all ballots cast in midterm elections.
- Since 2006, there has also been a difference in the rate of provisional ballots counted. Nearly 79 percent of provisional ballots issued were counted in midterm years and approximately 69 percent were counted during presidential years.
- The most common reason for rejecting a provisional ballot is the voter not being registered in the state, followed by not being in the correct precinct or correct jurisdiction.
- Four states accounted for most provisional ballots issued in 2016. Seventy-five percent of all provisional ballots issued were issued in Arizona, California, New York and Ohio. California alone accounted for more than half of all provisional ballots issued nationwide.
A key provision of the 2002 Help America Vote Act (HAVA) mandated provisional voting in nearly every state.1 This was included to provide a failsafe process for voters if their eligibility is in question when they are attempting to cast a ballot. During the 2000 elections, prior to HAVA, 17 states and the District of Columbia offered provisional voting.2
A provisional ballot is issued when there is a question of an individual’s eligibility to vote. Often, this is because the person is not on the official list of registered voters when they are attempting to cast a ballot in a particular election. Once cast, provisional ballots are kept separate from other ballots and are not tabulated until the eligibility of the voter is confirmed within a certain time after Election Day. Provisional ballots where the voter is determined to be ineligible are rejected and not counted. HAVA also requires state or local election officials to provide a free access system, such as a toll-free phone number or website, for people to check if their provisional ballot was counted and if it was not, why not.
Provisional Voting Nationwide
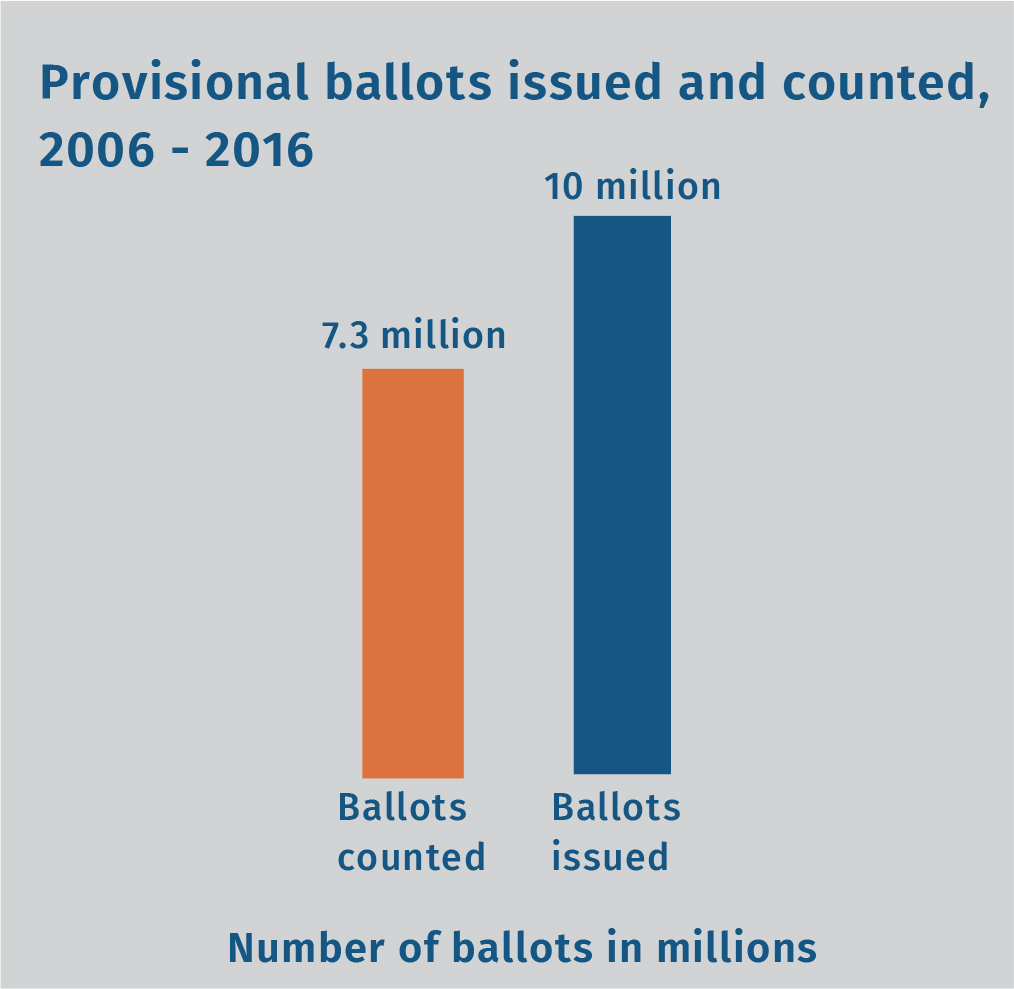
The EAVS has detailed provisional voting data for three presidential election cycles and three midterm election cycles.3 During this time, from 2006 to 2016, states and territories reported that more than 10 million provisional ballots were issued and more than 7.3 million of these were counted. The rate of use – the number of provisional ballots cast out of all ballots cast – has remained consistent nationally over this period of time. However, the rates during presidential cycles are higher than midterm cycles.
Approximately 1.1 percent of all ballots cast were provisional ballots in midterm elections from 2006 to 2014, while nearly 1.8 percent of all ballots cast were in presidential election cycles from 2008 to 2016. This rate in presidential election cycles is roughly 67 percent higher than midterms.
There is also a slight difference in the rates of counting provisional ballots between midterm and presidential elections during this time period, with nearly 79 percent of provisional ballots cast counted in full or in part during midterm elections, and 69 percent counted in full or in part during presidential elections.4
These rate disparities between presidential and midterm elections are influenced by multiple factors. At least one worthy of further exploration is the difference between voters who cast ballots during midterm elections versus presidential elections. Midterm elections with lower turnout likely have more regular and experienced voters casting ballots. Presidential elections are higher profile races with higher turnout and are more likely to have first-time or infrequent voters who have less experience with the voting process and may experience more challenges.
The most common reason for provisional ballot rejection in each election cycle since 2006 has been the voter not being registered in the state, meaning no record of the voter’s registration could be found. Of the approximately 2.4 million provisional ballots reported as rejected from 2006 to 2016, more than one million, or about 44 percent, were rejected for not being registered in the state. The next most common reasons for rejection have been for the provisional ballot being cast in the wrong jurisdiction (10.6 percent) or wrong precinct (7.7 percent). Additional reasons for rejection include, but are not limited to, insufficient identification, problems with the voter’s signature and problems with the provisional ballot envelope.5
Data Reflect Different State Laws
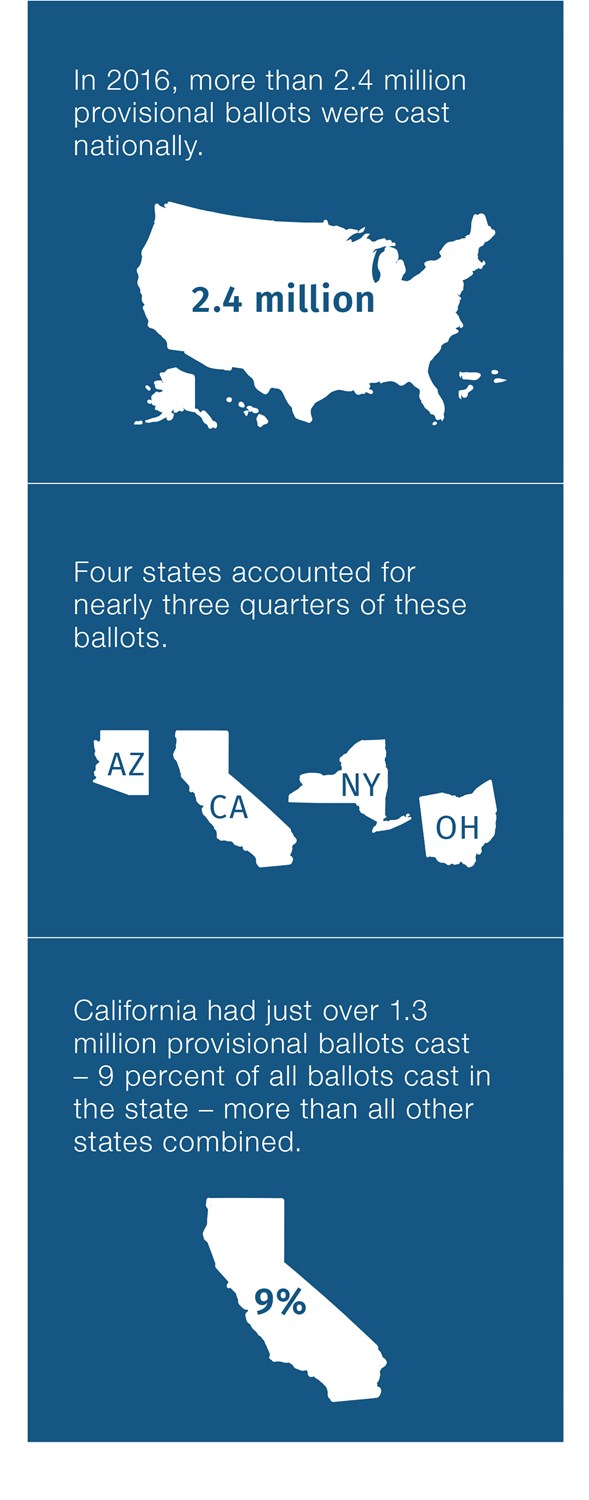
 States have varying rules when it comes to both why provisional ballots are issued and which ballots are eligible to be counted. In 2016, more than 2.4 million provisional ballots were cast nationally. Four states – Arizona, California, New York, and Ohio – accounted for nearly three quarters of these ballots. California alone had just over 1.3 million provisional ballots cast – 9 percent of all ballots cast in the state – more than all other states combined. From 2006 to 2016, these four states have accounted for 7 million of the 10 million provisional ballots cast nationwide.
One reason for the higher rate in California is provisional ballots are issued to voters who have moved within their county without re-registering to vote. State law requires the ballot be counted if the voter’s signature on the provisional ballot envelope matches the signature on the voter’s prior registration form. The local election official is also required to re-register the voter at their new address for future elections. Additionally, those who have requested a mail ballot and show up at the polls saying they did not receive a ballot can vote provisionally. These votes are counted if it is verified later that indeed they did not cast their mail ballots.6 In 2016, approximately 80 percent of provisional ballots were counted in full or in part in California.
By comparison, other states have different rules and fewer provisional ballots cast. In Kentucky for example, having moved within a county and not re-registering is not a reason to issue a provisional ballot in the state.7 On Election Day, a voter who has moved within the same county can go to the precinct that serves their new address to update their registration address and vote.8 In 2016, Kentucky reported issuing only 291 provisional ballots, just .01 percent of the more than 1.9 million ballots cast.
Other states have seen provisional ballot numbers shift dramatically due to policy changes. In 2013, a law was passed in Colorado allowing for all voters to receive mail ballots or cast ballots during an early voting period or on Election Day at a voter service and polling center. These centers allow for a voter to cast a ballot anywhere in the county, not at one assigned polling place location, meaning if a voter casts a ballot in the correct county, it is not possible to show up at the wrong precinct.
In addition, the law in Colorado allowed for same-day registration where eligible citizens can register to vote and cast a regular ballot at the same time.9 With this new law in place, the state saw a significant decrease in the use of provisional ballots from 2012 to 2016. In 2012, Colorado issued 62,847 provisional ballots statewide. 9,870 were rejected and 5,001 were rejected because the voter was not registered in the state. In 2016, the first presidential election under the new law, only 5,910 total provisional ballots were issued and of the 1,483 were rejected, none were reported rejected because the voter was not registered in the state.
Local Variation
There is also variation in the rates of issuing and counting provisional ballots within some states. While EAVS data does not necessarily provide specific reasons for this variation, it does help point to areas for further research.
In 2016, New Mexico election officials counted approximately 44 percent of 5,607 provisional ballots issued statewide.10 However, provisional acceptance rates varied greatly among the state’s three most populous counties.
The acceptance rate in Bernalillo County, the most populous in the state and home to Albuquerque, was close to the state average at around 39 percent. In neighboring Santa Fe County, the third-most populous county, the rate was considerably higher at roughly 67 percent. At the other end of the spectrum in Dona Ana County, the second-most populous county, about 9 percent of provisional ballots were counted.
In April 2018, the New Mexico Secretary of State’s office adopted a new administrative rule related to provisional ballots to codify “best practices regarding provisional voting so that the procedures are the same in every county,” offering guidance on each step of the process.11 Future iterations of the EAVS will hopefully provide some insights on the impact of this rule change.
Looking Ahead
Beyond New Mexico, moving forward the EAVS will help capture the impact of changing policy in other states as well. 2018 will be the first time that a new process called Conditional Voter Registration (CVR) will be used statewide in California. This allows any eligible citizen in the state, from 14 days prior through Election Day, to go to their county elections office and conditionally register to vote. The voter is given a voter registration affidavit to fill out and is then given a ballot that must be placed in a CVR envelope to be handled in a similar process to that of vote by mail ballots in the state.12
Since by far the most provisional ballots are issued to voters in California, this shift in policy will undoubtedly not only impact the state’s data, but national figures as well. In 2018 and beyond, the EAVS will measure the impact of this change and others and continue to be the sole source of provisional ballot data nationwide.
1. When HAVA was enacted, six states—Idaho, Minnesota, New Hampshire, North Dakota, Wisconsin and Wyoming— were exempt from provisional voting requirements. However a small number of provisional ballots are issued in some of these states. In 2016 for example, Wisconsin and Wyoming had provisional voters because the voter did not have correct identification (Wisconsin) or was challenged (Wyoming).
2. electionline.org, “The Provisional Voting Challenge,” 2001, http://electionline.org/images/Provisional_Voting.pdf.
3. This is data from 2006 to 2016. The EAVS was first administered in 2004 but the 2004 survey did not ask for detailed data about the reasons provisional ballots were rejected and is not included in this analysis.
4. Part of the provisional ballot is counted in some states if it is cast in the wrong precinct or jurisdiction. This generally means counting votes for the races the voter was eligible to vote for if they had been in the correct precinct or jurisdiction. Often this means counting votes for federal or statewide races.
5. The data for why provisional ballots are rejected is not complete. In 2016 for example, of the approximately 615,000 provisional ballots reported as rejected, 130,000 are listed as being rejected for “other” reasons and more than 85,000 are not categorized at all, meaning about one third of the reported rejected provisional ballots do not have a reason associated with them.
6. “Provisional Voting,” California Secretary of State, accessed May 15, 2018, http://www.sos.ca.gov/elections/voting-resources/provisional-voting/#mainCont.
7. According to the Kentucky State Board of Elections (see https://vrsws.sos.ky.gov/provweb/), the following are reasons provisional ballots can be issued:
- Voter whose name does not appear on the precinct roster and whose registration status cannot be determined by the precinct officer;
- Voter whose name does not appear on the precinct roster and who has been verified as ineligible to vote;
- Voter who does not have identification;
- Voter who is voting as a result of a federal or state court order or any order under state law in effect 10 days prior to Election Day which extends the polling hours; or
- Voter has been challenged by all four precinct election officers. Additionally in Kentucky an excuse is required to cast an absentee ballot and far fewer absentee or mail ballots are issued in comparison to California. And not having received an absentee ballot is not a reason in Kentucky to be issued a provisional ballot.
8. “Kentucky Voter Information Guide,” Kentucky State Board of Elections, revised July 2014, https://elect.ky.gov/SiteCollectionDocuments/Voter Information/SBE 1000 - Voter Information Guide (BQ)(LZ).pdf.
9. Colorado House Bill 13-1303, the Voter Access and Modernized Elections Act, went into effect on May 10, 2013.
10. Thirty of New Mexico’s 33 counties provided complete provisional ballot data in 2016.
11. “2018 Notice of Proposed Rulemaking - Provisional Voting,” New Mexico Secretary of State, accessed May 15, 2018, http://www.sos.state.nm.us/Elections_Data/notice-of-proposed-rulemaking-provisional-voting.
12. “Conditional Voter Registration,” California Secretary of State, accessed May 15, 2018, http://www.sos.ca.gov/elections/voter-registration/conditional-voter-reg/.


