

The EAC’s 2024 Election Administration and Voting Survey (EAVS) Data Interactive, hosted by Microsoft Power BI, is a data visualization tool that enables users to explore and analyze 2024 EAVS data at the state and local levels. Unlike the 2024 EAVS Comprehensive Report, the 2024 EAVS Data Interactive allows users to examine variations across states and localities on various election administration topics such as voter registration, UOCAVA voters, mail voting, poll workers, voter turnout, voting equipment, and more. For example, state election officials can use the interactive to compare their counties on specific EAVS data metrics, local election officials can use it to find similar jurisdictions across the country, and researchers can use the map for their own analysis. While there are many different applications for the data interactive, here are three instances of how the interactive can be helpful.
Use Case #1—For State Election Officials: Comparing Voter Registration Data Across Counties
Image
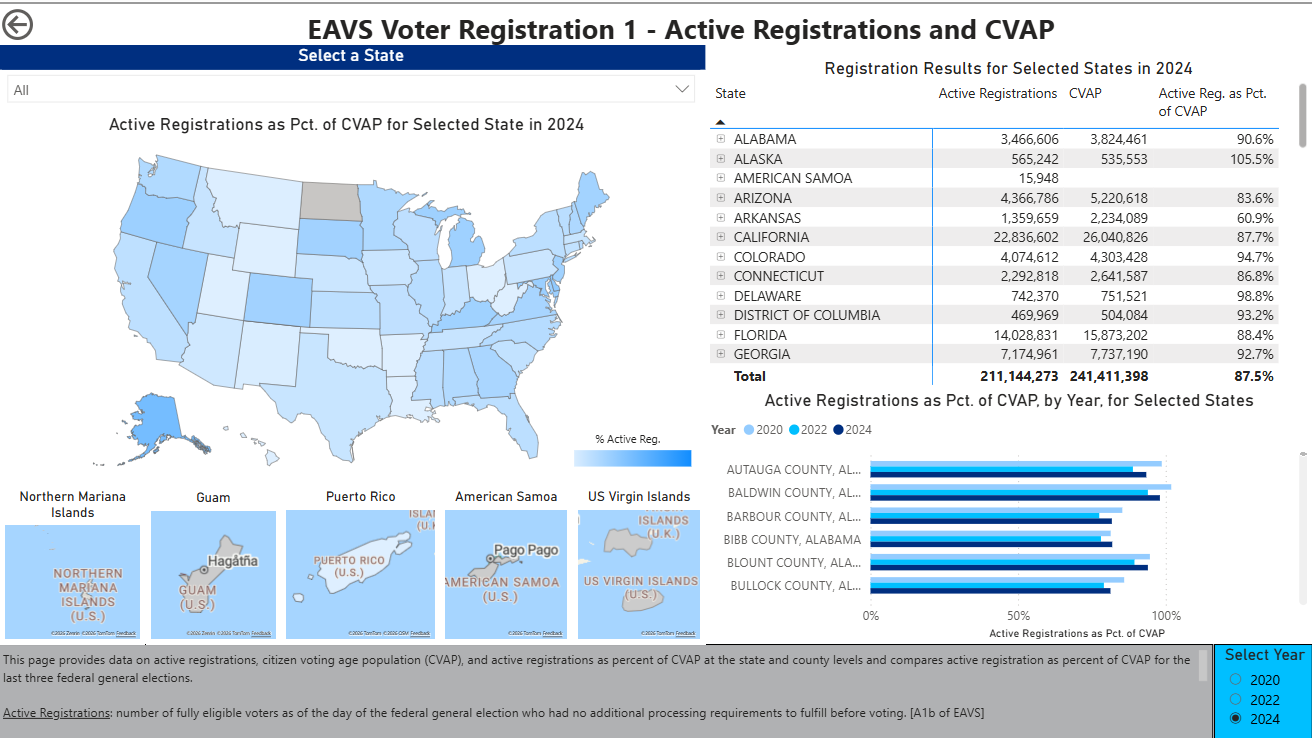
State election officials who are interested in viewing voter registration data across their respective counties and localities can use the first page of the data interactive “EAVS Voter Registration 1- Active Registrations and CVAP.” For example, states can use the table, in the top right-hand corner, to sort their counties/localities by specific metrics such as the number of active voter registrations and total registrations between the end of the 2022 election and the end of the 2024 election.
States are also able to see how active registrations as a percentage of CVAP changed across the last three election years (2020, 2022, and 2024) in the bar graph at the bottom right-hand corner. Additionally, state election officials can make similar county/locality comparisons looking at different metrics on the other pages of the data interactive.
Use Case #2—For Local Election Officials: Finding Similar Jurisdictions Across the Country
Image
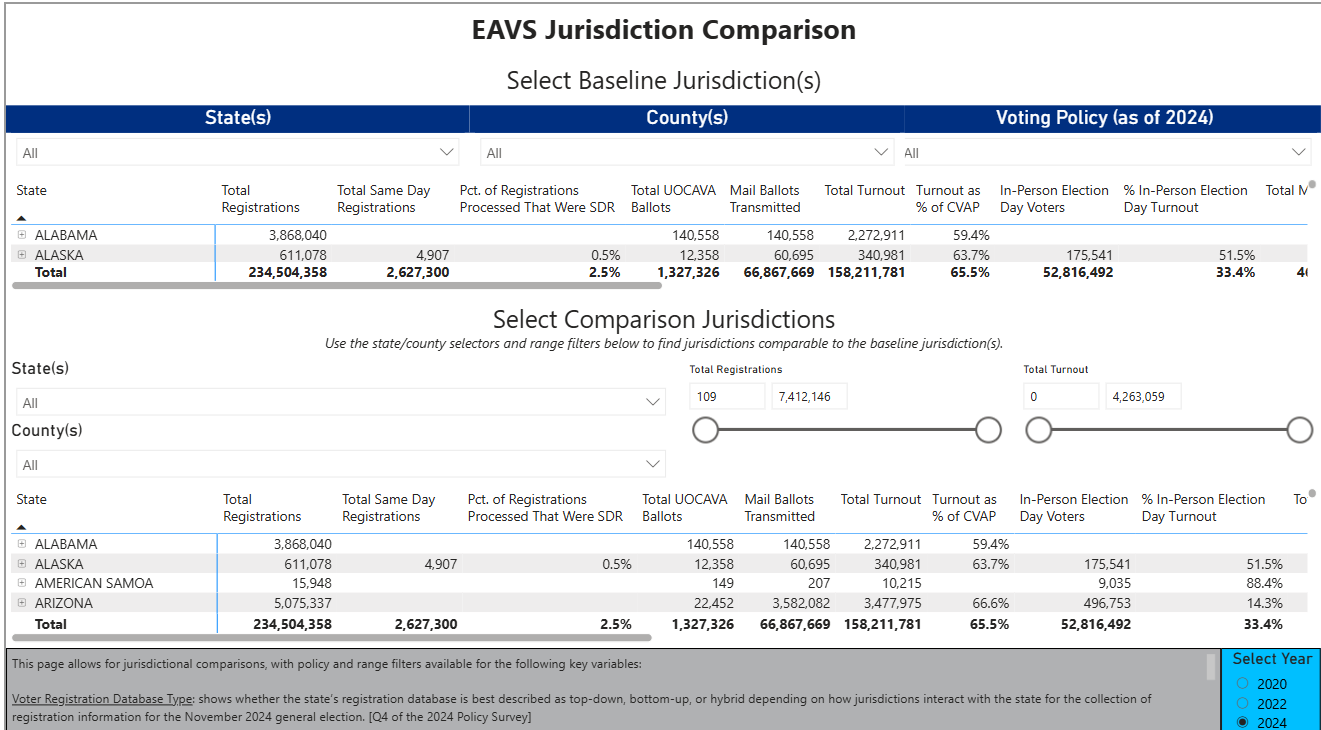
Local election officials who are interested in finding similar jurisdictions across the country can use the twelfth page of the data interactive “EAVS Jurisdiction Comparison” for that purpose. For example, a local election office that used electronic poll books in the 2024 elections can see which other localities also use e-poll books, when they click the “Voting Policy (as of 2024)” dropdown and select “Yes” under “Uses Electronic Poll Books.” Additionally, jurisdictions can narrow their results by changing the “Total Registrations” or “Total Turnout” range filters to focus solely on the jurisdictions that have similar data to their locality. This page would be a great starting point for local election offices to find similar jurisdictions to collaborate with on election administration topics.
Use Case #3—For Researchers: Interpreting Voting Policy Across States
Image
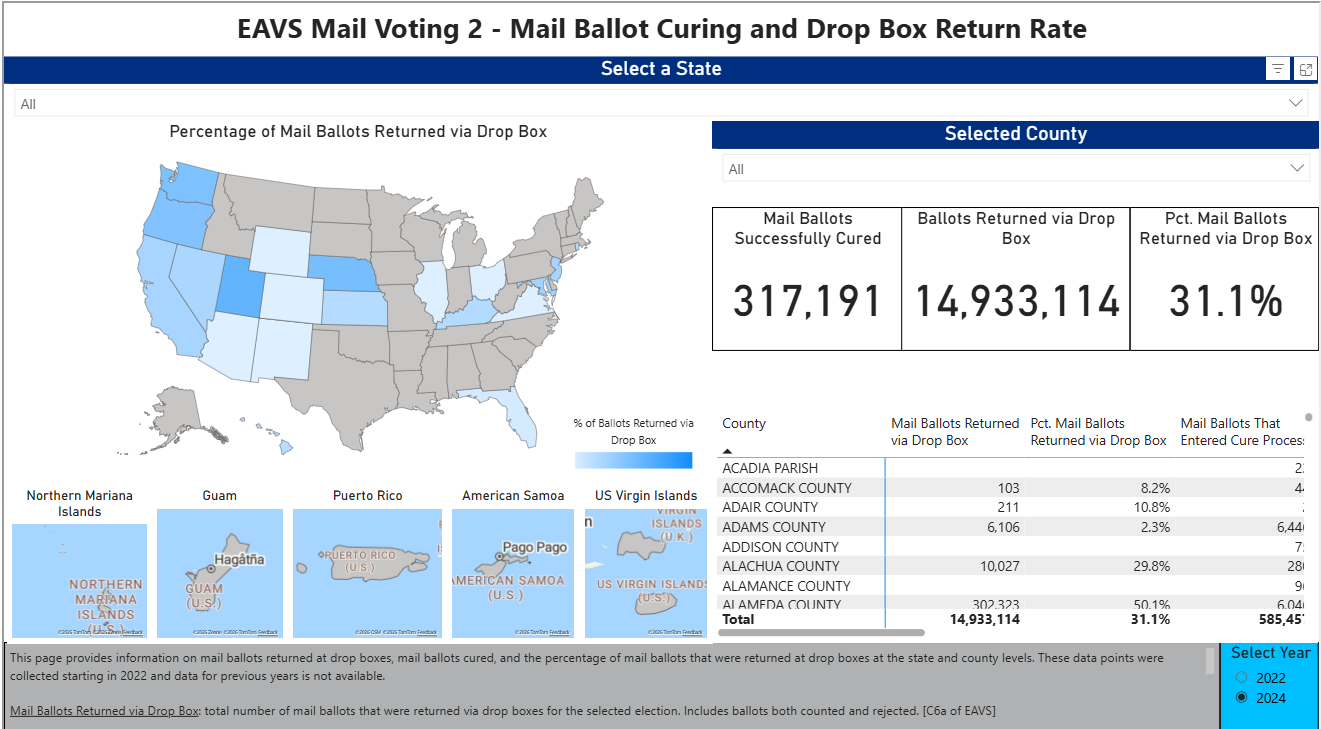
Researchers who specialize in studying mail voting and are interested in seeing new EAVS data, on mail ballot curing and mail ballot return by drop box can use the sixth page of the data interactive “EAVS Mail Voting 2- Mail Ballot Curing and Drop Box Return Rate” for their analysis. On this page, researchers will be able to see a map that shows the percentage of mail ballots returned by drop boxes in each state. Specifically, they will be able to see the variation of this percentage across the country. The table at the bottom right-hand side of the interactive will allow researchers to compare mail ballot curing and mail ballot return by drop box data by locality across the country or within specific states. The tables also allow users to sort by each data column.
These three examples are just some of the ways users can utilize the 2024 EAVS Data Interactive which can be viewed and downloaded on the EAC’s EAVS Data Interactive page. This page also includes a short instructional video to explain how to use the Data Interactive for those who are not familiar with Power BI. Users can also find our four past data interactives, starting with the 2016 EAVS, as well as other EAVS data, and reports on this page. If you have questions or comments on this data interactive, please email [email protected].