
The EAC administers the biennial Election Administration and Voting Survey (EAVS) to collect state-by-state data on the administration of federal elections. In June of 2017, the EAC released the most recent survey with data from the 2016 election.
This survey contains the most comprehensive data about trends in election administration in the United States and provides these numbers at the national, state, and local level. This brief is part of a series of “deep dives” into the EAVS data that will provide an in-depth look at a variety of issues related to administering elections and use data to help better understand these issues.
Early, Absentee, and Mail Voting
Overview
-
The percentage of voters who cast their ballots on a voting machine at a polling place on Election Day has declined steadily over the past decade, while the number of states offering early voting, no-excuse absentee voting, and vote by mail has increased.
-
The total number of voters who voted early, absentee or by mail more than doubled from 24.9 million in 2004 to 57.2 million in 2016, representing an increase from one in five of all ballots cast to two in five of all ballots cast.
-
The number of U.S. citizens voting early more than doubled from nearly 10.2 million early ballots cast in 2004 to 24.1 million early ballots cast in 2016.
- In 2016, 16 states showed a combined percentage of greater than 50 percent of votes cast early, by mail, or via absentee voting.
Early, Absentee, and Mail Voting
Voting in the Unites States in the 21st century has undergone some significant changes since the Norman Rockwell image of the voter in the polling booth. One of the most significant changes is the trend of more and more people receiving and casting ballots before Election Day.
Each state has its own laws and regulations governing when, where, and how voters can cast ballots. All states allow for some form of absentee voting by mail, however this process is administered in different ways by the states, including:
Excuse required absentee voting: A voter must provide a reason why they are casting an absentee ballot and cannot appear to vote on Election Day.
No-excuse required absentee voting: A voter does not need to provide a reason why they are casting an absentee ballot and cannot appear to vote on Election Day.
Permanent absentee voting: A voter can sign up once to receive an absentee ballot and will receive absentee ballots in all future elections.
Vote by mail: All registered voters in the jurisdiction are mailed a ballot.
Additionally, certain states allow for early voting, which allows qualified voters to cast a ballot in person at designated locations and during specific times prior to Election Day. In the Election Administration and Voting Survey (EAVS), early voting data includes both early votes cast on voting machines and absentee ballots that are cast at an in person location prior to Election Day.
More People Voting Early, Using Mail and Absentee Ballots
Percent Voting Absentee, By Mail, or Early, 2004-16
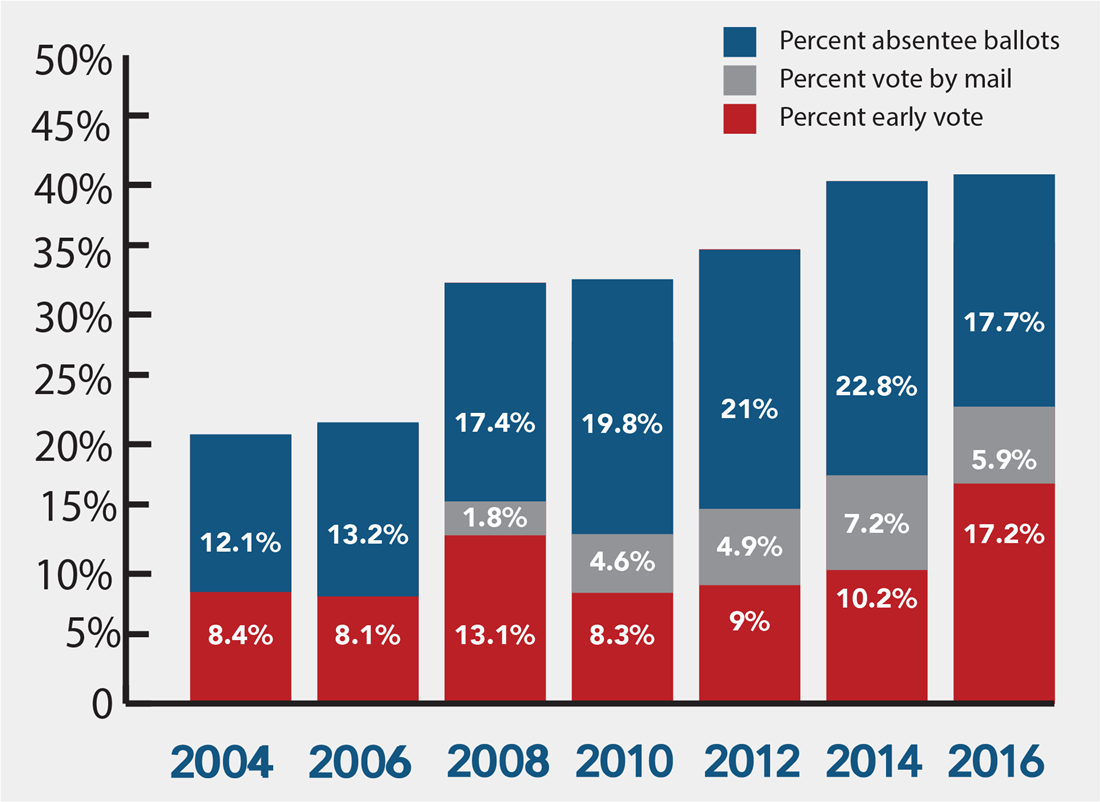 Chart Caption: Data includes all 50 states,
Washington, D.C., American Samoa, Guam, Puerto Rico, and the U.S. Virgin Islands. Mail Ballots were not tracked in the EAVS until 2008.
Chart Caption: Data includes all 50 states,
Washington, D.C., American Samoa, Guam, Puerto Rico, and the U.S. Virgin Islands. Mail Ballots were not tracked in the EAVS until 2008.
There has been a steady increase in the number and percentage of voters voting early in both presidential and off year federal election years since 2004, when the EAVS was first administered the percentage voting early more than doubled from 2004-2016, rising from 8.4 percent to 17.2 percent, with nearly 10.2 million early ballots cast in 2004 and 24.1 million early ballots cast in 2016. The number of absentee ballots cast by absentee voters nearly doubled, from 14.7 million in 2004 to 24.8 million in 2016. Mail voting was tracked beginning in 2008, and the number showed a steady increase through 2016, more than tripling from 2.4 million in 2008 to 8.2 million in 2016. The total number of voters who voted by one of these three methods more than doubled from 24.9 million in 2004 to 57.2 million in 2016, or from one in five of all ballots cast to two in five of all ballots cast.
| State | Total Votes | Early, Mail, Absentee Totals | Early, Mail, Absentee Percents |
|---|---|---|---|
| Arizona | 2,722,660 | 2,042,084 | 75.0% |
| Arkansas | 1,048,513 | 627,411 | 59.8% |
| California | 14,610,494 | 8,592,587 | 58.8% |
| Colorado | 2,884,199 | 2,722,919 | 94.4% |
| Florida | 9,613,669 | 6,555,802 | 68.2% |
| Georgia | 4,147,181 | 2,426,261 | 58.5% |
| Hawaii | 437,697 | 229,562 | 52.4% |
| Montana | 516,901 | 333,666 | 64.6% |
| Nevada | 1,128,492 | 781,788 | 69.3% |
| New Mexico | 804,073 | 541,730 | 67.4% |
| North Carolina | 4,690,195 | 3,055,960 | 65.2% |
| Oregon | 2,051,452 | 2,051,452 | 100.0% |
| Tennessee | 2,545,271 | 1,679,087 | 66.0% |
| Texas | 8,701,152 | 5,452,437 | 62.7% |
| Utah | 1,114,567 | 772,888 | 69.3% |
| Washington | 3,363,452 | 3,287,705 | 97.7% |
Trends in the States
In 2016, 16 states showed a combined percentage of greater than 50 percent of votes cast early, by mail, or via absentee voting.
Colorado, Oregon and Washington have the highest rates because each is a mail voting state and almost all of their votes were mail ballots. Six additional states reported over 50 percent of their votes as absentee ballots: Arizona, California, Florida, Hawaii, Montana, and Utah. Seven states reported having over 50 percent of their votes cast early: Arkansas, Georgia, Nevada, New Mexico, North Carolina, Tennessee, and Texas.
Impacts
Early, absentee and mail voting has had a variety of impacts on the election process, including implications for voter accessibility. The 2016 Survey of the Performance of American Elections (SPAE) found that “33 percent of voters 70 years and older voted absentee, compared to 20 percent of voters in their thirties” and that “30 percent of voters with a disability that kept the voter ‘from participating fully in work, school, housework, or other activities’ voted absentee, compared to 22 percent of voters without a disability.”1 Similarly, a report on the participation of individuals with disabilities found that: “Individuals with disabilities also report voting by mail at much higher rates than do individuals not reporting a disability. This is especially true for people with disabilities that constrain them getting out of the house – people with self-care and independent living difficulties.”4
Another trend to watch is the way voters return ballots they receive in the mail. In the states where election officials mail ballots to all registered voters, recent data shows the majority of those voters do not return their ballots in the mail. They either drop them off at designated locations or at drop boxes.
Amber McReynolds, director of elections for the City and County of Denver, has said: “Essentially, it’s ballot delivery. And I very specifically say that. I don’t call it ‘vote by mail.’ And the main reason why is that most voters actually return their ballot in person, as opposed to using the Post Office to mail it back.”3 In her county in 2016 for example, 80 percent of those who cast a mail ballot dropped those ballots off rather than used the mail.4
Denver is not alone. The 2016 SPAE asked mail voters how they returned their ballots. In Colorado, 73 percent of those surveyed said they dropped them off in person, 59 percent reported they did so in Oregon, and 65 percent in Washington.5
Looking Ahead
EAVS data show that the percentage of voters who cast their ballots on a voting machine at a polling place on Election Day has declined steadily over the past decade, while the number of states offering early voting, no-excuse absentee voting, and vote by mail has increased. As more states consider options such as vote by mail, the EAVS will capture if and how this trend continues.
1 “2016 Survey of the Performance of American Elections, Final Report,” Charles Stewart III, The Massachusetts Institute of Technology, p. 13.
2 “Defining the Barriers to Political Participation for Individuals with Disabilities,” Thad E. Hall and R. Michael Alvarez, May 14, 2012, p. 4.
3 Amber McReynolds, director of elections for the City and County of Denver, “View it From a Different Angle,” U.S. Election Assistance Commission Election Data Summit, Aug. 12, 2015, /videos/view-it-from-a-different-angle-amber-mcreynolds-director-of-elections-denver-co/.
4 “2016 General Election Review,” Denver Elections Division, Office of the Clerk and Recorder, https://www. denvergov.org/content/dam/denvergov/Portals/778/documents/VoterInfo/2016DenverElectionsByTheNumbers.pdf.
5 “2016 Survey of the Performance of American Elections, Final Report,” Appendix 4.