
The Election Assistance Commission (EAC) administers the biennial Election Administration and Voting Survey (EAVS) to collect state-by-state data on the administration of federal elections. In June of 2017, the EAC released the most recent survey with data from the 2016 election.
This survey contains the most comprehensive data about trends in election administration in the United States and provides these numbers at the national, state and local level. This brief is part of a series of “deep dives” into the EAVS data that will provide an in-depth look at a variety of issues related to administering elections and use data to help better understand these issues.
Overview
- From 2012 to 2016, there was a significant increase in the use of electronic poll books (e-poll books) nationwide. The number of in-person voters checked in with e-poll books more than doubled, increasing 110 percent from 19.7 million to 41.4 million voters.
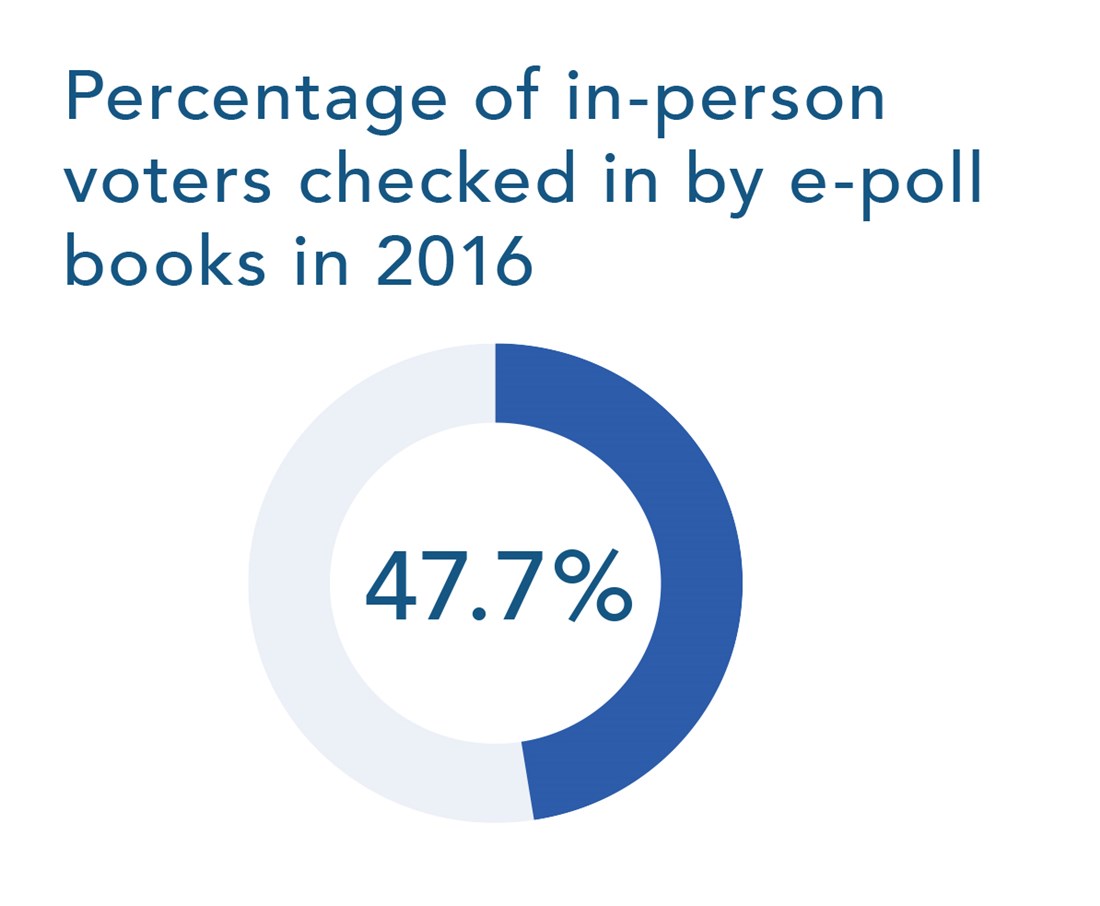
- Nearly 48 percent of voters who cast ballots in person in 2016 were signed in at the polls by election workers using e-poll books, compared to only 27 percent in 2012.
- Thirty-two states, the District of Columbia and U.S. Virgin Islands reported using e-poll books in at least one jurisdiction in the 2016 elections. Five states used e-poll books statewide.
- Optical scan machines remain the most popular type of voting equipment in the country and were used by approximately 61 percent of jurisdictions in 2016. Jurisdictions using hybrid voting machines increased by 4 percent between 2008 and 2016, while those using direct recording electronic (DRE) voting machines without a voter-verified paper audit trail (VVPAT) decreased by 3 percent over the same period.
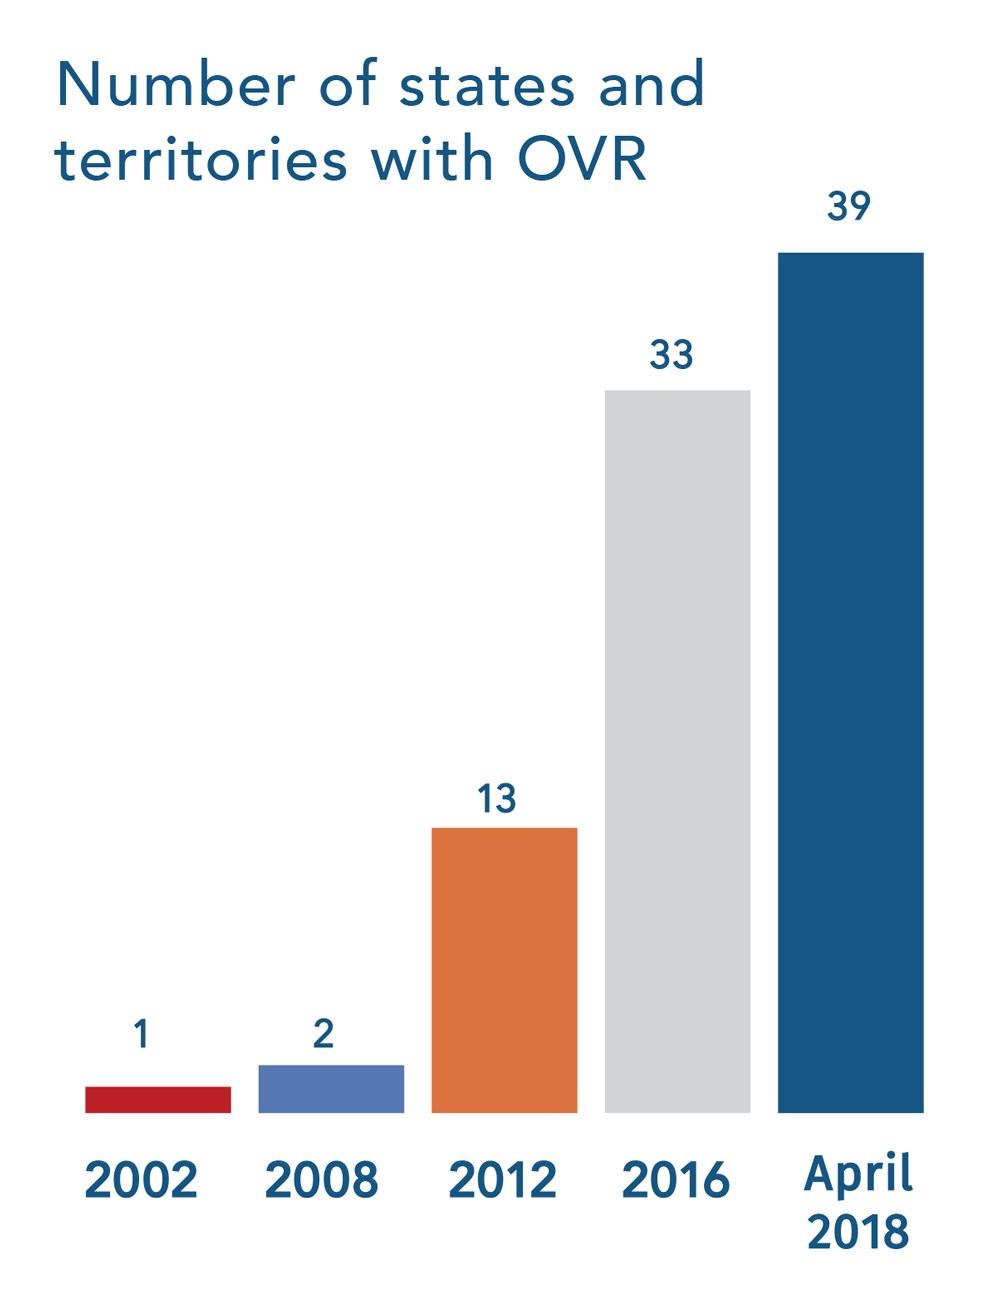
- Online voter registration (OVR) accounted for nearly 18 percent of all voter registration applications for the 2016 elections, more than triple the rate from 2012.
- Six additional states have implemented OVR since 2016. Today, 37 states, the District of Columbia and Guam offer OVR.
Since the EAC was established in 2002, digital technology has significantly changed the way elections are administered in the United States. Computerized statewide voter registration databases have been adopted in all states with voter registration. Online voter registration has spread to nearly three-fourths of the states. The use of e-poll books is on the rise. Lever and punch-card machines have been phased out and electronic voting equipment that allows voters to cast, and election officials to count, ballots has spread to every corner of the country. More recently, there appears to be a gradual decrease in the use of paperless voting systems.
These technological changes have considerable implications for election efficiency and integrity, voter experience and confidence, accessibility, and the roles of election officials at all levels. This rings especially true today as election officials across the country seek to modernize and better secure their election systems in the aftermath of the 2016 elections. The following EAVS Deep Dive examines data on election technology from across the country to support and inform these efforts.
Voter Registration Databases
The Help America Vote Act (HAVA) of 2002 required states with voter registration to adopt a computerized statewide voter registration list. According to information collected by the EAC through the Statutory Overview, a component of the EAVS since 2008, all states now meet this requirement.1 The adoption of centralized voter registration databases has enabled states to improve their voter registration list maintenance practices through greater and more effective sharing of voter information within each state and across state lines. Statewide computerized voter registration lists have also enabled states to better compare and verify records with other government-operated databases.2
Interstate Data Sharing
Most states engage in interstate sharing of voter registration data to support their voter registration and list maintenance efforts, including participation in two prominent interstate data sharing initiatives: the Electronic Registration Information Center (ERIC) and the Interstate Voter Registration Crosscheck (known as Crosscheck). ERIC, a non- profit corporation governed by a board of directors drawn from its member states, seeks to assist states in identifying inaccurate or out-of-date voter registration records, and reaching out to eligible but unregistered residents. Twenty-two states and the District of Columbia participate in ERIC. Crosscheck is managed by the Secretary of State’s office in Kansas and seeks to identify possible double registrations and double votes. Twenty-six states reportedly participate in the Crosscheck initiative.3 Ten states participate in both efforts. In 2014, the Presidential Commission on Election Administration recommended that interstate exchanges of voter registration information such as these be expanded.
Online Voter Registration
Enabled by the centralization and computerization of voter registration lists, states began to offer online voter registration (OVR) in 2002. OVR allows those eligible to complete and submit a voter registration application or update their information entirely online.
For the 2016 elections, OVR was offered in 31 states, the District of Columbia and Guam. Since that time, six additional states — Florida, Idaho, Ohio, Rhode Island, Tennessee and Wisconsin — have implemented OVR. Oklahoma enacted OVR in 2015, but has not yet implemented it. This leaves 11 states and three territories that have neither enacted nor implemented OVR, including the heavily populated states of Michigan, New Jersey, North Carolina and Texas.
Number of states and territories with OVR
According to EAVS data, 17.4 percent of all voter registration applications were processed online for the 2016 elections.4 This was more than triple the rate from 2012, when only 5.2 percent of applications took place via OVR.
For 2016, nearly 13.5 million registration applications were submitted online, inclusive of both new applications and updates to existing registrations. OVR applications accounted for more than 10 percent of all applications in 25 states. California experienced the highest OVR rate in the country in 2016, processing nearly half, or 48.2 percent, of its registration applications online. Arizona, the first state to adopt OVR in 2002, processed 40.6 percent of its applications online for 2016.
Electronic Poll Books
The greater computerization of voter registration lists described above is also changing how voters are checked in at the polls.
While a large percentage of jurisdictions continue to use preprinted paper registration lists to check in voters at the polls (81.8 percent in 2016), an increasing number of jurisdictions are now using e-poll books for this task. In addition to signing in voters, some jurisdictions use e-poll books to update voter history and/or to help voters locate polling places (e.g. those who arrive at the incorrect polling place).
Among responding jurisdictions, the number of in-person voters checked in using e-poll books more than doubled from 2012 to 2016, increasing 110 percent from 19.7 million to 41.4 million voters. Approximately 47.7 percent of all voters who cast ballots in person in 2016 were signed in at the polls by election workers using e-poll books.5 In 2012, only 27.3 percent of in-person voters were checked in using e-poll books.6 The number of jurisdictions using e-poll books to check in voters also rose significantly, increasing 71.9 percent from 645 jurisdictions in 2012 to 1,109 jurisdictions in 2016.
Percentage of in-person voters checked in by e-poll books in 2016
At least 32 states, the District of Columbia and the U.S. Virgin Islands reported using e-poll books in at least one jurisdiction in the 2016 elections.7 Five states — Colorado, Georgia, Maryland, North Carolina and South Carolina — utilized e-poll books in all jurisdictions statewide. A handful of additional states had e-poll book usage to sign in voters in at least two-thirds of their jurisdictions in 2016, including Michigan (97.6 percent), Florida (83.3 percent), Iowa (74.4 percent), Arizona (73.3 percent) and New Mexico (69.7 percent).
E-poll book usage is more prevalent in jurisdictions that serve higher numbers of in- person voters. Among the 336 jurisdictions that reported processing more that 50,000 in-person voters in 2016, nearly 56 percent of them used e-poll books to sign in voters at the polls. When looking at all responding jurisdictions, only 17.7 percent of jurisdictions used e-poll books for this purpose.8
Voting Technology
The methods by which voters cast their ballots, and election administrators count them, have also undergone considerable changes in recent years. To help the nation better understand these changes, the EAC has been collecting information on voting technology since the first EAVS on the 2004 elections.
Building on questions in use since the 2008 survey, the 2016 EAVS asked about the eight categories of voting systems listed below. Definitions for these systems are provided in Appendix I. While the terminology used for voting technology continues to evolve, this categorization allows for some level of comparisons and trend analysis over time.
- Optical scan
- Direct recording electronic (DRE) voting machines without a voter-verified paper audit trail (VVPAT)
- DREs with a VVPAT
- Hybrid voting machines9
- Hand-counted paper ballots
- Punch cards
- Lever machines
- Other systems
The EAVS helped document the nation’s shift away from lever machines and punch-card ballots as states replaced voting equipment and began to adopt new technologies. In the 2004 elections, roughly 6 percent of jurisdictions (394 jurisdictions) reported using lever systems and 4 percent (260 jurisdictions) reported using punch-card systems. Lever systems appear to have been last used during the 2008 elections.10 Similarly, punch-card systems appear to have been last used during the 2014 elections.11
In 2016, election offices used a range of voting systems, which primarily included optical scan machines, hybrid machines and DREs, both with and without a VVPAT.12 Voting systems that include a paper component were most prevalent in 2016, and the use of paperless systems appears to be gradually decreasing over time.
Used by roughly 61 percent of jurisdictions in 2016, EAVS data shows that optical scan machines (which scan paper ballots or paper records) are the most popular type of voting equipment in the country.
EAVS data also shows a gradual increase over time in the use of hybrid voting machines (which create paper ballots or paper records that are then scanned). In 2008, approximately 29.8 percent of jurisdictions reported using hybrid machines.13 This grew to 33.2 percent in 2012 and further to 34.1 percent in 2016.
In addition, EAVS data appears to show a gradual decrease over time in the use of DREs without a VVPAT.14 In 2008, roughly 24.6 percent of jurisdictions reported using DREs without a VVPAT. This decreased to 19.6 percent in 2012 then grew slightly to 21.5 percent in 2016.
The shift away from DREs without a VVPAT is more apparent at the state level. For example, Maryland last reported using DREs without a VVPAT in all jurisdictions in 2014. While not yet reflected in EAVS data, Virginia also decided to no longer use DREs following the 2016 elections, including those without a VVPAT.15
Only five states reported using DREs without a VVPAT statewide exclusively for in-person voters during the 2016 elections: Delaware, Georgia, Louisiana, New Jersey and South Carolina.16 Fifteen states in total reported using these voting machines in some of their jurisdictions in 2016.17
Looking Ahead
EAVS data has helped illustrate the changing landscape of voting system usage across the country and the evolving terminology in this space. Recent surveys also helped reveal the rapid expansion of online voter registration and e-poll book usage across the country. Information collected through the EAVS Statutory Overview has further informed our understanding of how voter registration databases function across the states. Future surveys will continue to collect data on these issues as states grapple with balancing the efficiency and accessibility gains of these technologies against heightened security concerns.
As paper-based and auditable systems have received renewed attention following the 2016 elections and the replacement of aging voting equipment remains a persistent challenge for election officials, the EAVS will continue to capture data on this important topic and provide a better understanding of changes in this area.
On March 23, 2018, Congress appropriated $380 million in election security grants, made available to all 50 states, the District of Columbia, Puerto Rico, Guam, American Samoa and the U.S. Virgin Islands, to improve administration of elections for federal office, including to enhance election technology and make election security improvements. Just as EAVS data helped us understand the impact of HAVA funds on the states’ use of election technology following the 2000 elections, future surveys will help tell the story of how these grants are implemented and their impact on election technology usage across the country.
1 North Dakota is exempt from this requirement because it does not conduct statewide voter registration. North Dakota does, however, maintain a computerized statewide list of those who have voted.
2 See this EAC blog post and the states’ Statutory Overview responses for more information on how voter registration databases function in each state (e.g. as top-down, bottom-up or hybrid systems). The responses also have information on how states compare and verify records with other government-operated databases, such as vital statistic agencies, the Social Security Administration and departments of Motor Vehicles.
3 A 2017 Kansas Secretary of State’s office presentation showed 30 participating states in 2016. Since 2016, one state has reportedly joined the Crosscheck initiative, while four states have withdrawn their participation.
4 This is inclusive of all reported voter registration applications processed from the close of registration for the November 2014 elections to the close of registration for the 2016 elections.
5 In-person participation figures used for this analysis were calculated by adding those who voted at a physical polling place on Election Day, those who voted using a provisional ballot, and those who voted at an early vote center. The calculation excludes the 13.3 percent of jurisdictions (856 jurisdictions) that did not provide sufficient data on the relevant EAVS questions for 2016.
6 The calculation used here excludes the 17.6 percent of jurisdictions (1,432 jurisdictions) that did not provide sufficient data on the relevant EAVS questions for 2012.
7 A few states and territories did not respond to the e-poll book-related questions on the EAVS. The actual number of states and territories that used e-poll books in 2016 is likely slightly higher than 34. For example, American Samoa did not respond to the EAVS survey in 2016, but reported using e-poll books in the 2012 elections.
8 In total, 5,600 of 6,467 jurisdictions responded sufficiently to the relevant questions on in-person voting and e-poll book usage.
9 This is labeled an “electronic vote selection, printed and optically scanned ballot” system in the survey. See the full definition in Appendix I. It is a “hybrid” in the sense that it allows a voter to mark their ballot like a DRE, but produces a paper record to be tabulated through an optical scan or similar sensor.
10 A minute number of jurisdictions reported using lever systems through 2014, including two jurisdictions in 2008, one in 2010, one in 2012 and one in 2014. Responses beyond 2008 appear to be erroneous as they conflict with previous years’ reporting on the questions.
11 Two jurisdictions reported using punch-card systems in 2016, but these responses appear to be erroneous as they conflict with previous years’ reporting on the questions.
12 Note that many jurisdictions use multiple types of election equipment (e.g. DREs for in-person voting and optical scan machines for processing mail ballots, or optical scans for most in-person voting along with DREs for voters with disabilities, etc.).
13 These calculations exclude Wisconsin, which changed its level of reporting jurisdiction between surveys (from 72 counties in 2008 to 3,541 jurisdictions in 2012, and down to 1,854 jurisdictions in 2016). This created a large shift in the total number of responding jurisdictions, which can skew percentage-of-jurisdictions-based calculations of change over time when included.
14 These calculations again exclude Wisconsin. Response rate may also play a factor in these calculations. There was a 91.2 percent response rate to questions relevant to these calculations in 2008, rising to 94.2 percent in 2012, and rising further to 95.4 percent in 2016.
15 Virginia Board of Elections News Release. September 8, 2017.
16 Four of these five states reported using a small number of optical scan machines in each of their jurisdictions, which were used to process absentee or provisional ballots.
17 Two additional states reported having jurisdictions with this voting equipment, but information from the chief election office in the states shows the EAVS responses to be erroneous.
Appendix I
The following definitions of voting system categories was included in the 2016 EAVS Supplemental Instruction Manual.
Direct recording electronic (DRE) voting machines without a voter-verified paper audit trail: A voting system (push-button or touch screen) that records votes by means of a ballot display provided with mechanical or electro-optical components activated by the voter, where voting data are stored in a removable memory component. DRE is also referred to as an “electronic” voting system.
Direct recording electronic (DRE) voting machines with a voter-verified paper audit trail: A voting system (push-button or touch screen) that records votes by means of a ballot display provided with mechanical or electro-optical components activated by the voter, where voting data are stored both in a removable memory component and on a paper document that the voter can review before officially casting his or her ballot.
Hybrid or Electronic vote selection— printed and optically scanned ballot: A vote selection system (push-button or touch screen) in which the voter selects candidate choices by means of a ballot display provided with mechanical or electro-optical components activated by the voter, but no voting data is stored in the system. Instead, a paper ballot is printed that contains marks in voting response fields that are read by an optical scanner or similar sensor.
Optical scan: A system of recording votes by marks in voting response fields on ballot cards that are read by an optical scanner or similar sensor. These are also referred to as “mark-sense” voting systems.
Punch cards: A system of voting by punching holes in a card with a supplied punch device to indicate candidate or ballot issue choice. The ballots are counted using a computer punch card reader.
Lever machine: A system where each candidate or ballot issue choice is assigned a particular lever in a rectangular array of levers on the front of the machine. The voter pulls down selected levers to indicate choices. Vote totals are kept on a counter wheel within the machine.
Hand-counted paper ballots: A system where voters mark a paper ballot by hand and then each race on each ballot is counted by hand, without the use of a scanner, tabulator, or sensor.